There is a concept of analyzing metrics to determine the effectiveness of your content. This article will explain how using metrics can determine the effectiveness of your content and serve as a basis for its further improvement, what metrics are worth knowing and how to effectively apply them to achieve your goals.

What are metrics and what are they for?
Performance metrics are parameters needed by companies, but in our case affiliates, to evaluate the success of an advertising campaign and identify aspects that need improvement. These metrics help to determine how well the process is going.
The information helps to do analytics and optimization of advertising campaigns, for example, whether the work is in plus, whether it brings enough traffic, helps to adjust the strategy of work
Metrics
Views
Once the budget starts to spin off, we are seen by potential (or not so potential) customers. This metric gives insight into how many showings there have been across different sources.
Clicks
You get clicks on an ad if the ad hits the core of the target audience and sparks users’ interest.
CPC (Cost per Click)
Cost per Click. Helps you understand the cost of a potential customer. The currency depends on the advertising source and where the ad account was registered.
CPC = Advertising Costs / Number of Clicks
CPM (Cost per Millenium)
Cost per 1000 views. Suitable more for coverage, which means that there is a risk of draining the budget. The benefit of this type of advertising is that any coverage is recognizable. A person who previously did not know about you, may see your ad a couple of times and become interested.
CPM = cost of advertising * 1000 / reach.
CTR (Click through Rate)
Click through rate. It shows how often your ad is clicked on. If your CTR is a large number, don’t be too happy.
CTR = Number of clicks * 100% / Number of ad impressions
It is important to pay attention to the quality of the attracted applications, and what happens to them further. For example, CTR is 20%, but at the same time 0 applications and sales. What can this be? Here are a few reasons:
- The ad is clickable, but it’s attracting untargeted traffic;
- The offer does not match what is in the ad;
- Problems with the website;
- Traffic is attracted, but you are not working out the requests.
EPC (Earnings Per Click)
Earnings per click. The indicator is calculated as the ratio of total net income to the number of clicks from which this income was received.
The higher the indicator, the more earnings.
Do not forget that EPC shows only the level of income, expenses are not taken into account.
EPC = Payout amount / number of clicks
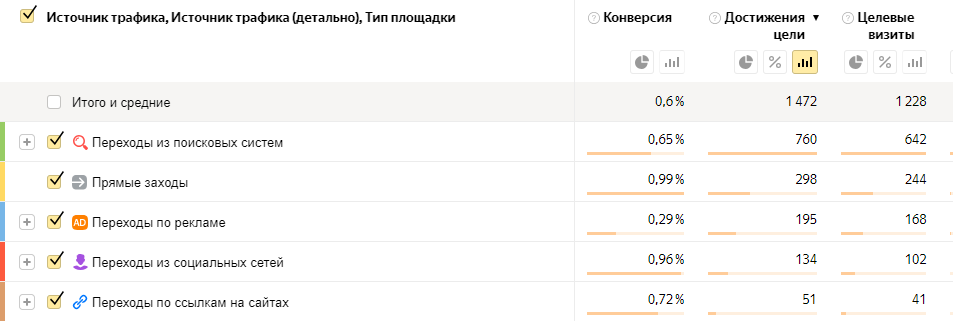
CR (Conversion Rate)
This is a very important indicator for evaluating traffic sources. The higher the rate, the more applications you get. It is mandatory to take into account what happens next with the traffic. It is measured in percentages.
CR = Number of targeted actions * 100% / Number of ad conversions
Leads
The number of applications received and yes, this is an important metric too. It shows the real result of different traffic sources.
CPL (Cost per Lead)
The cost of attracting a request. This indicator is needed to understand whether you are working in a plus or not. Knowing the intermediate business conversions helps you understand how much a request should cost.
CPL = Contextual advertising costs / Number of leads
CPO and CPS (Sales)
Cost per Order – cost of sale / cost of completed order.
CPO = Contextual advertising costs / Number of confirmed orders
Cost per Sale – the same, but this metric is more for working on CPA model. CPA model of attracting traffic is a type of work in which you pay for a specific result.
- payment for leads;
- payment for registrations;
- payment for sales;
- payment for any other action (views, clicks, downloads, etc.).
ROI (Return on Investment)
This metric shows whether or not all your startup costs/investments have been recouped, measured as a percentage.
ROI = (profit – advertising investment)*100% / advertising investment
ROMI and ROAS.
ROMI (Return on Marketing Investment) is a measure of return on marketing investment. The difference between ROI and ROMI is that ROI counts all investments in the startup as a whole, while ROMI only counts marketing investments.
ROMI = (return on advertising – expenses) / expenses*100%
ROAS (Return on Advertising Spend) is the ROI of the advertising campaign. In this case, you can evaluate the results of both a specific advertising campaign and a specific key phrase or banner that was used in the ad.
LTV (Lifetime Value)
A metric that shows how much money came from a customer over the entire time of interaction with the company. The indicator makes it possible to forecast income for the entire period of work with the user. Segmenting customers and comparing lifetime value will help to choose optimal promotion channels for different groups of users.
LTV = revenue from the client – the cost of attracting and retaining a client
Website performance metrics
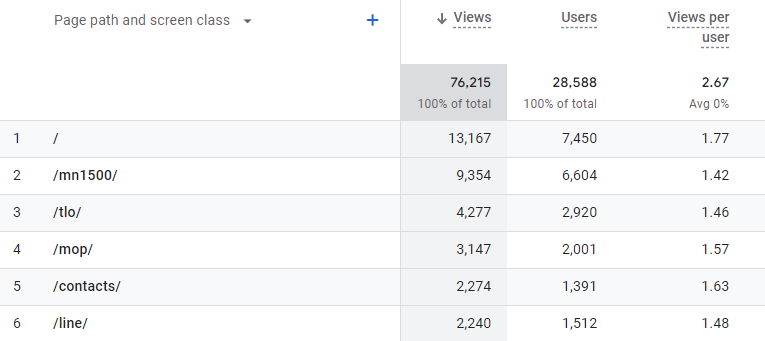
Number of visitors
You can track the total number of visits or unique users depending on your analytics goals. Various methods are used to attract users to the site, including SEO optimization, which helps to increase the number of visitors due to high positions in search results for topical queries. It is important that the quality of content is at a high level, as it helps to get backlinks from blogs, social networks and professional communities. You can also launch a campaign in Yandex.Direct or VKontakte advertising account.
The bounce rate
A high percentage of visitors who quickly leave the site, indicates that the user did not find the information he needs on the page, or he did not like the interface. In any case, this is a signal to the owner that the site needs something to fix and finalize. Sites that have a high bounce rate are worse ranked by search engines, so over time the number of visitors will decrease.
If the bounce rate on the site exceeds 20%, it may indicate the presence of problems: long loading time, inconvenient navigation, irrelevant content, incorrectly configured targeting and other factors. It is important to analyze bounce rates on different pages of the site using Yandex.Metrics to identify the reasons why users linger in some sections and quickly leave others. This will allow you to optimize the platform and improve the situation.
Conversion rate
The main goal of a business website is for visitors to perform a desired action: leave their contact information, subscribe to a newsletter, purchase a product, register, and so on. There are usually multiple conversion points on a website, and the metrics can vary. If one element of the call to action is working less effectively, it’s worth identifying the cause and fixing it. Perhaps the problem lies in uninteresting content, poor design, or an unfortunate page structure.
Session duration
Yandex.Metric tracks the activity of website visitors, determining the period during which they interact with different pages, perform targeted actions, etc. This tool helps to determine whether the traffic on the site is targeted. The evaluation of this indicator can vary depending on the characteristics of the site itself. For example, for an online store, a long time spent by a visitor on one page can be a negative sign, indicating problems with page loading or navigation. At the same time, for blogs with expert content, a long time spent on one page may indicate that the visitor is interested in the information presented.
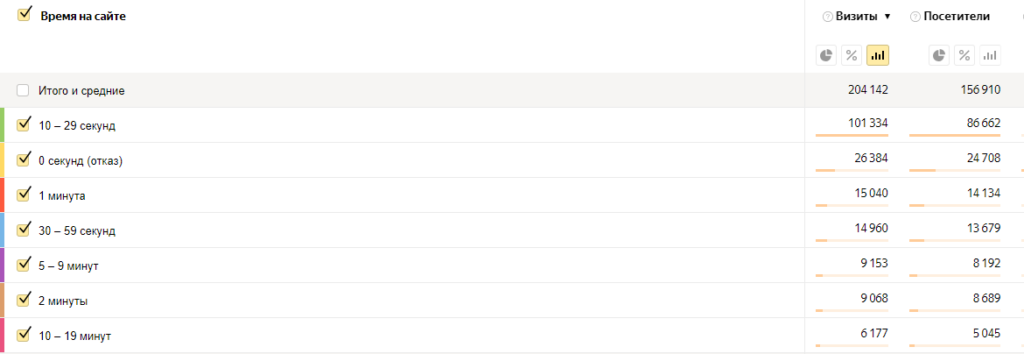
Average time on page
To fully understand the situation, it is important to know how much time users spend on the pages of the site. If a lot of people visit the site, but stay on it for a short time, it may mean that the traffic is untargeted. This could be due to low interest in the content or a lack of relevant products and services.
Your goal is to increase the time users stay on the site, as long as other metrics support the effectiveness of those visits. Long dwell time on the page but no increase in conversions may be due to barriers to making a purchase.
Usually, the average time for blogs is 3-5 minutes, and for online stores – 1-2 minutes. If your indicators differ from these standards, it is worth working on your content: it should be relevant, clear and engaging. You should also attract the target audience through SEO-optimization and placing affiliate links on other resources.
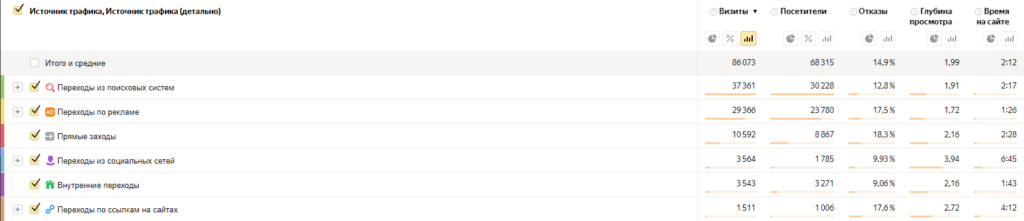
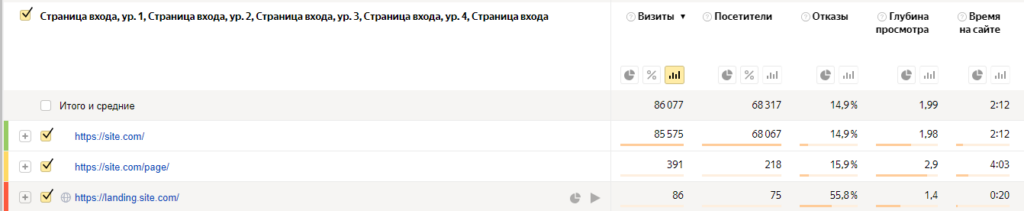
Traffic sources
This information will help to adjust the advertising strategy and reallocate the budget in favor of tools that proved to be the most effective.
All channels of attracting users to the site are divided into several groups:
- rganic search. People find you by entering a relevant query into the search box.
- Paid search. Users are attracted by your ad in the search results.
- Link clicks. Posting links on external sites or social networks.
- emails. Visitors who will receive the offer via email.
- Direct Entry. These are users who are already familiar with your product and come to the site by typing the address into the browser bar.
Learning about traffic sources will help you optimize your visitor acquisition methods to attract your target audience.
First Page Sage research confirms that the highest conversion rates for B2C are seen with organic search traffic (2.6%) and emails (2.4%)
On-site behavioral metrics
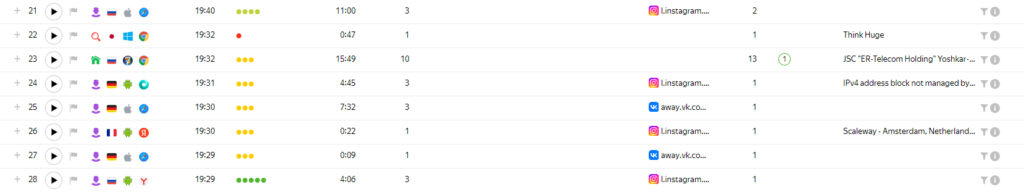
Time spent on pages and user behavioral patterns matter. To find out how they move around the site, which sections are more popular, in what order they view the sections of the site – study webvisor, click and scrolling map.
For example, Google Analytics has a useful tool “Behavior Map”, which shows the user’s path from page to page. It will show on which section the user stayed longer, and which one did not arouse his special interest.
Yandex.Metrics Webvisor records all visitor actions in a video file and provides a brief description, so you can observe the sequence of user actions from the beginning to the end of the session. This universal tool for tracking behavioral metrics remembers all clicks, keystrokes, scrolling and form filling, as well as copying.
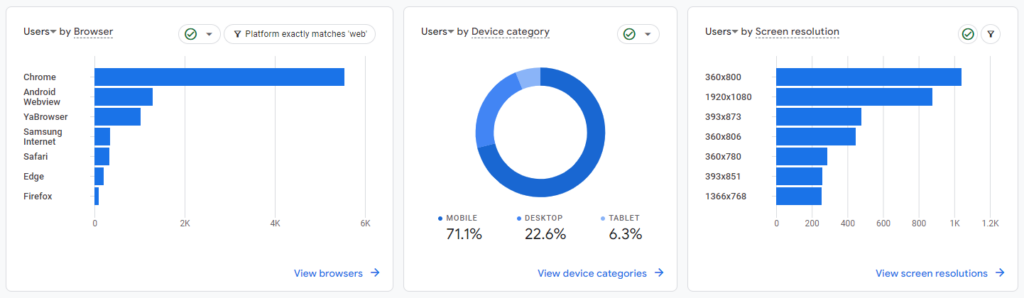
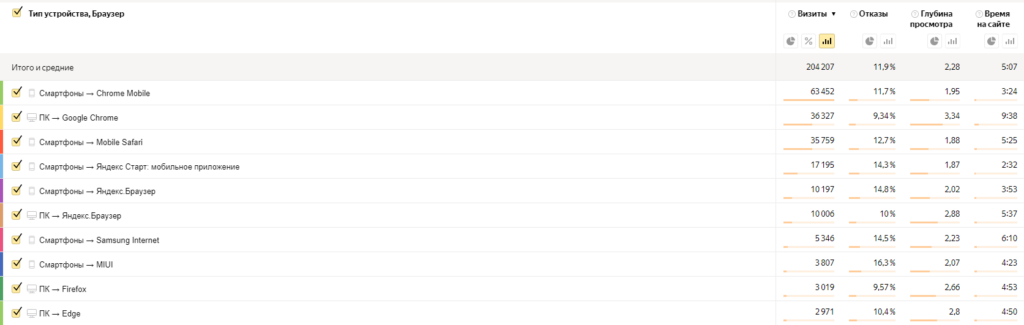
Devices
With an idea of the ratio of gadget types, as well as the operating systems and browsers used, you can achieve a perfect adaptation of your resource on all gadgets and OS.
Users browse websites from personal computers/laptops, tablets and smartphones. This will expand your audience at the expense of users who left your site due to the lack of an adapted version for his device.
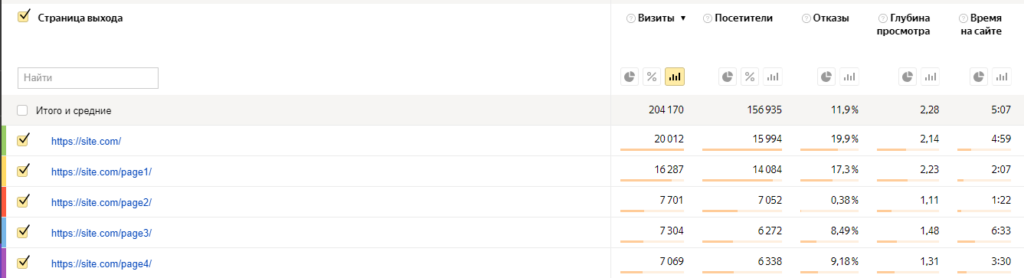
Exit Rate
The main purpose of creating a website is to attract targeted traffic to convert into users, the exit should be from a page designed for that purpose, such as a download or thank you for registering. It is bad if visitors leave the site en masse on a page where you need to perform a targeted action. Then you need to take measures to solve such a problem.
For example, potential customers may be deterred by a too long form for registration or going to a million links. It is worth reducing the number of mandatory blocks or lines to a minimum.
Depth of browsing
This key metric of a site’s effectiveness reflects how many pages a user views in a single session. The goals of the owners of different types of resources may differ. For example, for an online store, it is important for the visitor to view as many products as possible. If the browsing depth indicator is 3, it can be considered low. However, it is not advisable to evaluate the success of the site solely by this metric. The user may have quickly found the right product and made a purchase. Much more alarming is the scenario when the depth of views is high, but the number of purchases is zero. This may indicate problems with navigation on the site or a mismatch between the store’s assortment and visitors’ requests.
Conclusion
Metrics are an important part of any advertising or marketing campaign. They are the metrics by which you will understand how things are going with the promotion of your product. Those tools and techniques that seemed promising may not work in reality. And vice versa, will show themselves well methods on which you did not even bet. Rely not on intuition, but on accurate marketing data, and your chances of success will increase many times over. We wish you success and great results!